Getting Started
To get started with SEED, you need to log in with you account credentials, and then the main screen will be displayed.
Getting Started
Getting Started
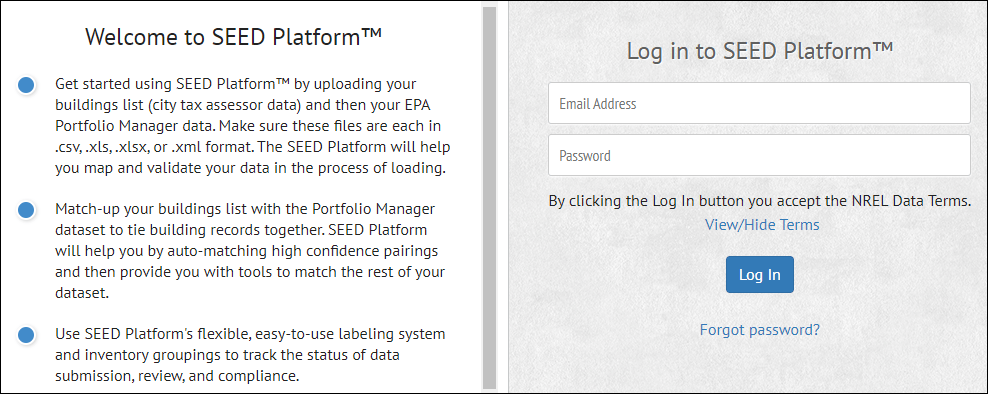
Log in to SEED
The first thing to do is to log in to SEED with your user email and password. These are assigned to you by the SEED administrator.
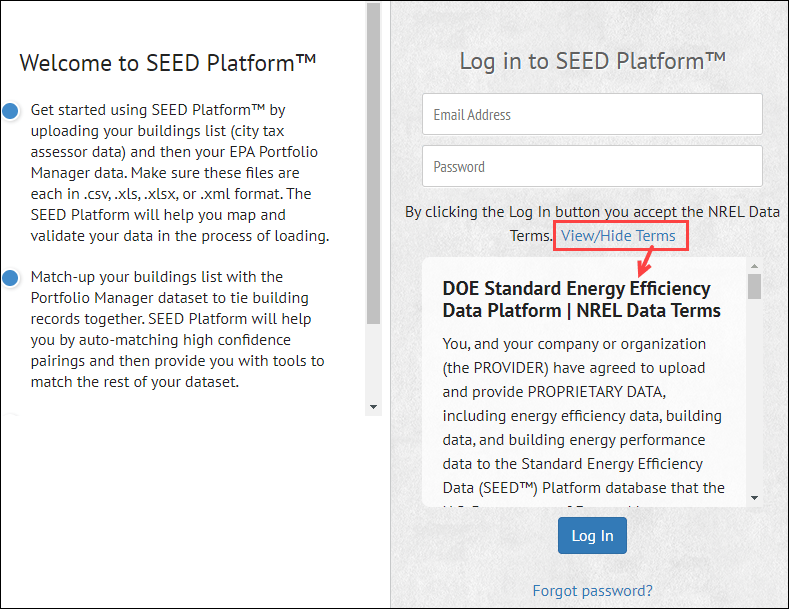
To see the NLR Data Terms for SEED, click the "View/Hide Terms" link
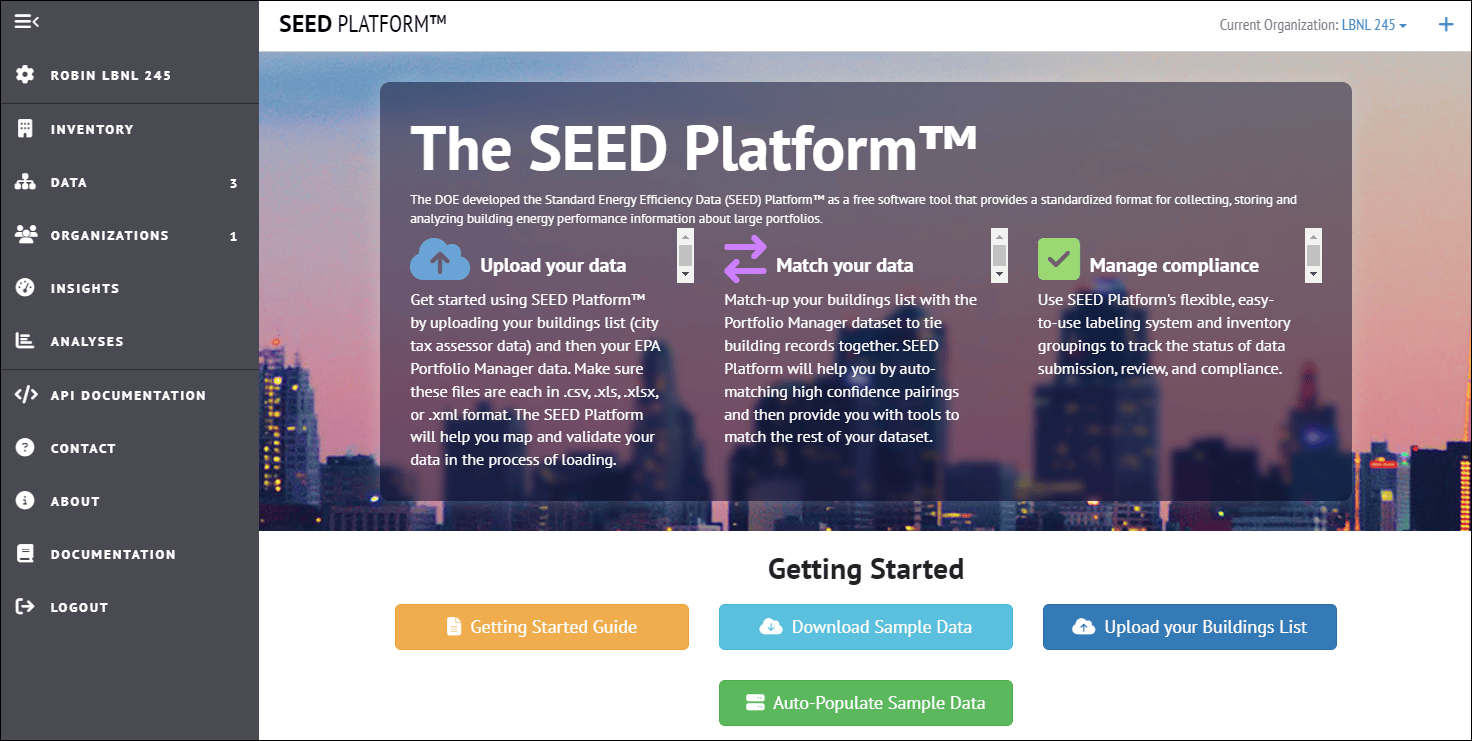
Main screen
After logging in to SEED, you will see the main screen
Sample Data
The SEED Sample Data collection includes two files and can be downloaded from the table below:
- covered-buildings-sample.csv—sample tax assessor data with 512 building records
- portfolio-manager-sample.csv—sample Energy Star® Portfolio Manager® data with 512 records which match the data in covered-buildings-sample.csv based on the Address field
Note that this represents an ideal case, but it can be used to confirm proper program performance.
All sample data should work with all versions of SEED, although the newer datasets may contain fields that do not exist in earlier versions.
| Version | Files |
|---|---|
| 2.7.0-Beta | Covered Buildings Sample File Portfolio Manager Sample File |
| 2.6.1 | Covered Buildings Sample File Portfolio Manager Sample File |
See the Importing Data page for more information on importing data.
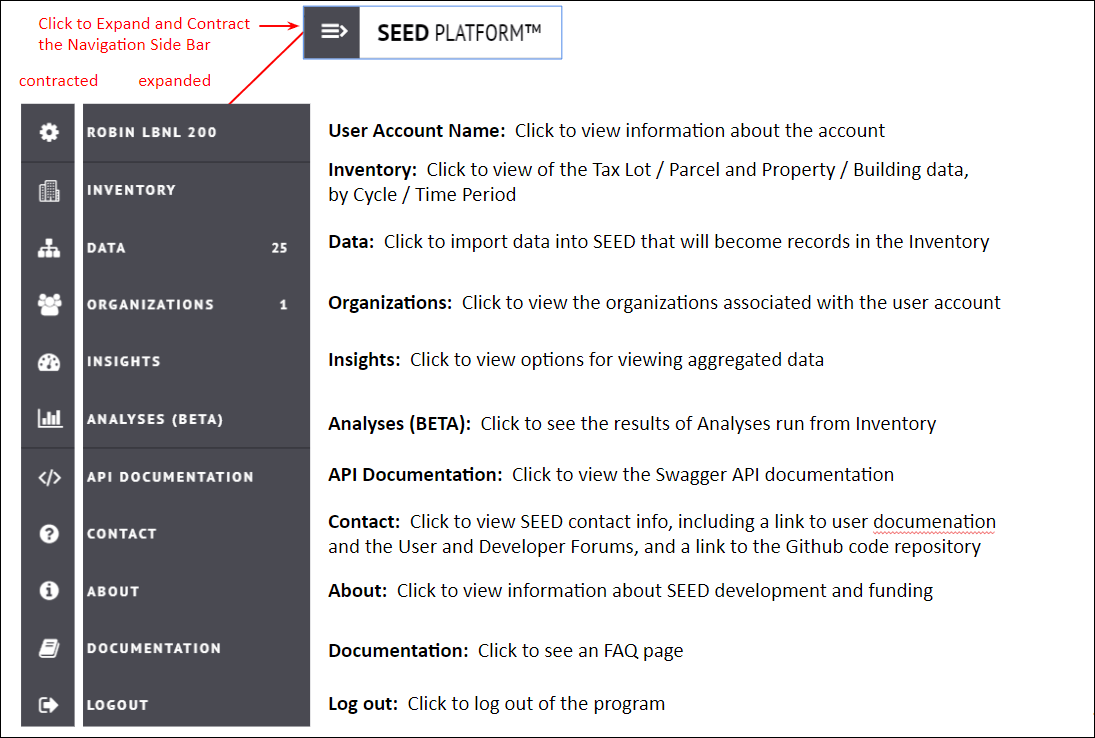
Main Navigation
The primary navigation options in SEED are shown on the left hand side of every screen, and they can be expanded to show full titles or collapsed to just show icons.
Main Navigation
Inventory
The Inventory screen displays the buildings that have been imported into SEED.
Inventory
After building data are imported into SEED, they can be accessed from the Inventory navigation button. The data can be viewed by cycle, as well as by Property and Tax Lot.
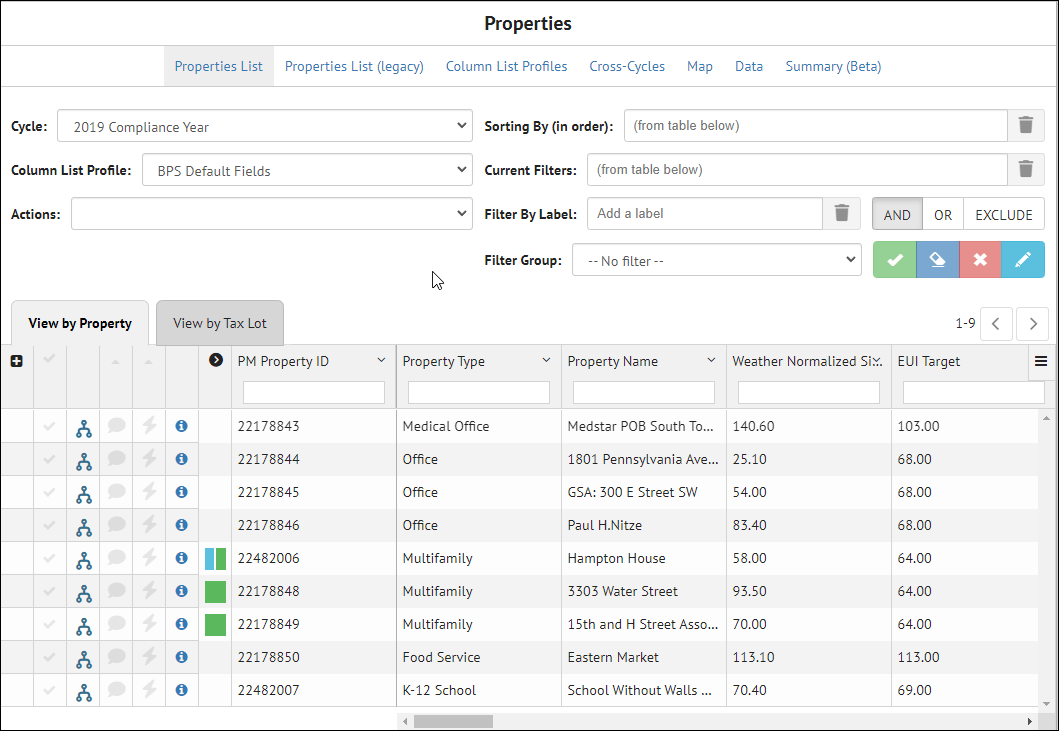
The links at the top of the page allow different views of the data, as follows:
-
Properties List: Displays the latest version of the Properties List view
-
Column List Profiles: Allows creation of multiple field lists with different fields selected
-
Cross-Cycles: Allows viewing data across multiple cycles
-
Map: If the properties have been correctly geocoded, they will be displayed on a map based on those locations
-
Data: Links to Insights
-
Summary (Beta): Displays summary information about the records and fields by cycle
Data
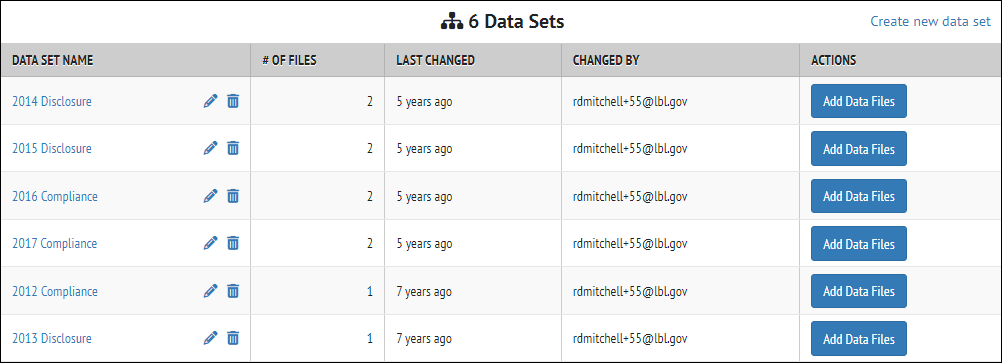
The Data navigation tab will take you to the Data Sets view, where Data Sets (groups of imported files) can be created, and files imported. For Energy Benchmarking and Building Performance Standards, creating data sets based on compliance years is a standard method of organizing the data imports.
Data
There are several types of data that can be imported, including
-
Spreadsheets with one line per building, such as from Tax Assessor data or real estate data
-
ENERGY STAR Portfolio Manager data for one or more buildings with Annual Energy Data
-
ENERGY STAR Portfolio Manager data for one or more buildings with Monthly Energy Data
-
GeoJSON data for spatial data information, such as latitude and longitude
-
Data from the DOE tool Audit Template or Asset Score (via the BuildingSync format)
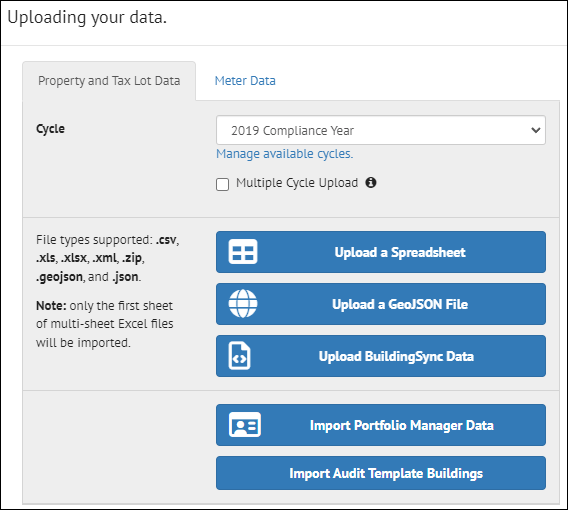
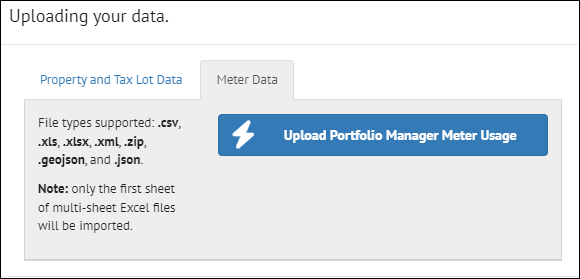
It is also possible to upload meter data from the same file, such as an ENERGY STAR Portfolio Manager file that has monthly meter data, using the Meter Data tab
Organizations
The Organizations navigation button is used to view many of the options for setting up the data import and data management.
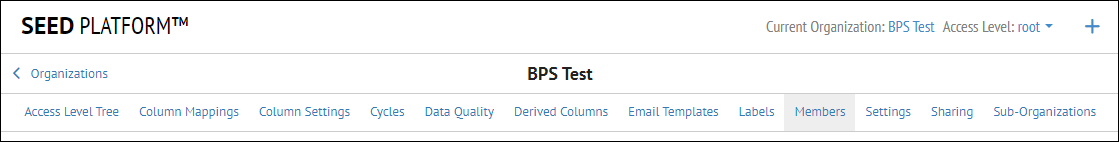
Organizations
The links across the screen under "Organizations" allow setting up various options for the entire SEED organization.
Those links are the following
-
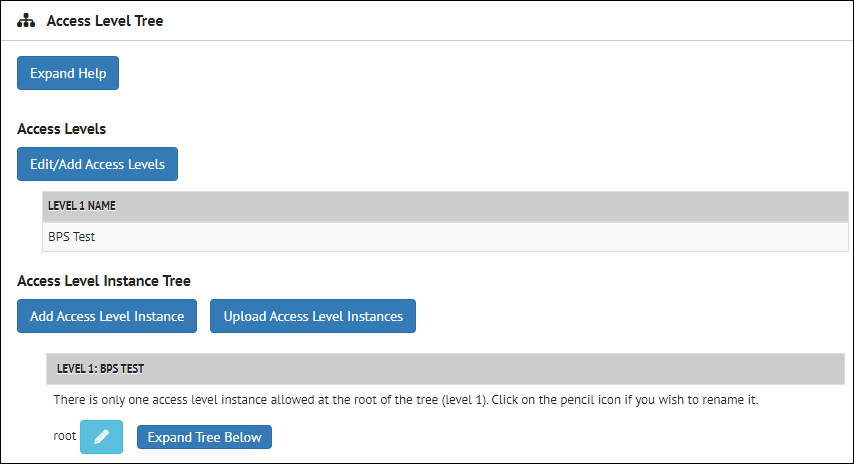
Access Level Tree: Manage the hierarchy of user permissions and levels of access to the data
-
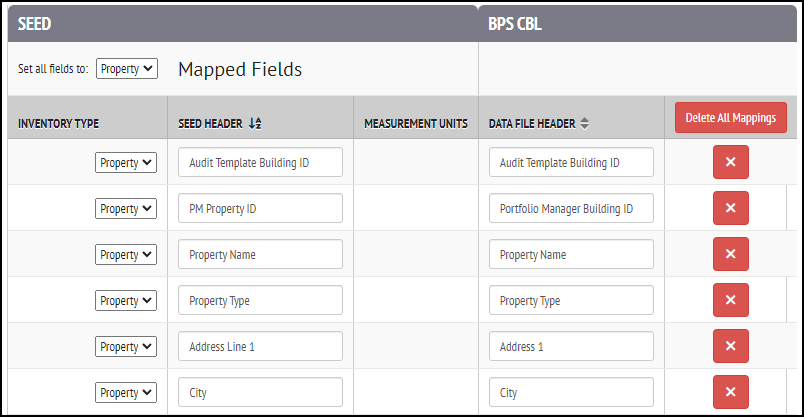
Column Mappings: manage the field names that are mapped on import, creating Column Mapping Profiles for different file types
-
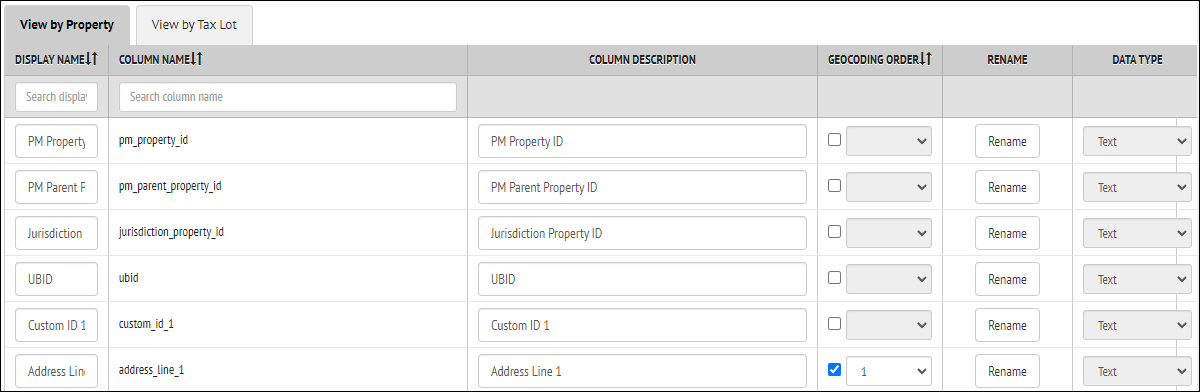
Column Settings: manage various settings for the mapped fields, including:
- display name
- column name
- column description
- geocoding order
- rename
- data type
- matching field
-
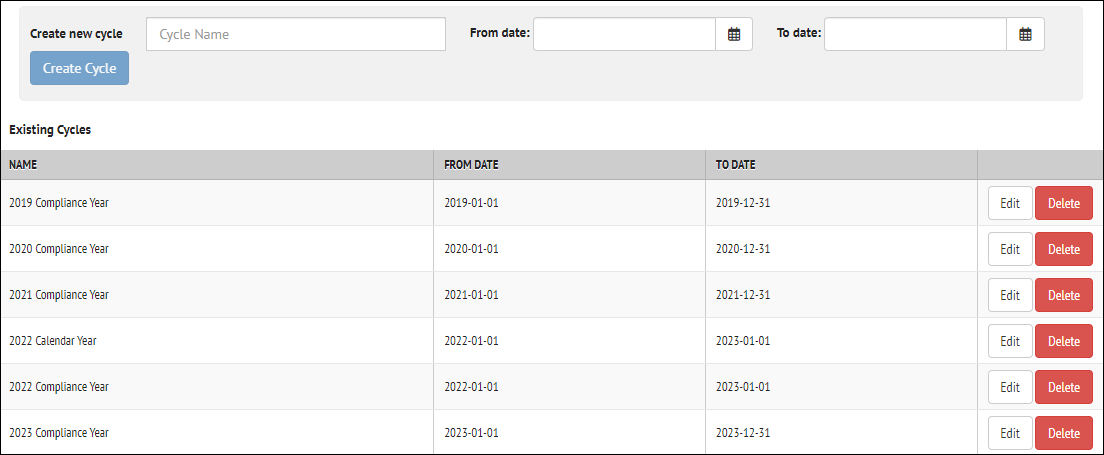
Cycles: manage cycle definitions, including creating new cycles, editing existing cycles (both names and dates), and deleting existing cycles
-
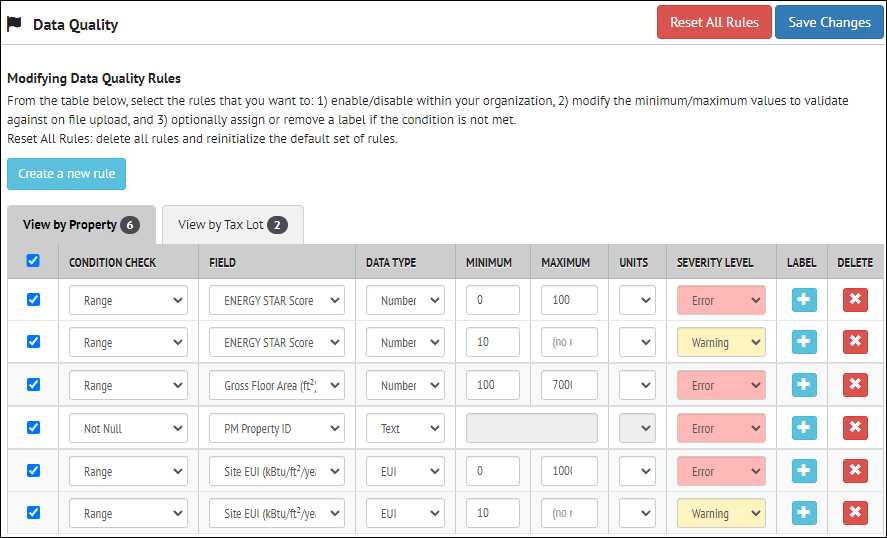
Data Quality: manage data quality rules, including defining new rules and adding labels to them, editing and deleting existing rules
-
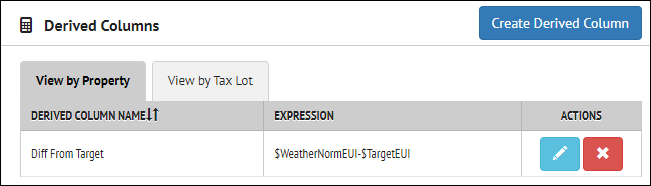
Derived Columns: manage derived columns (fields calculated from other fields), including creating new fields, editing and deleting existing fields
-
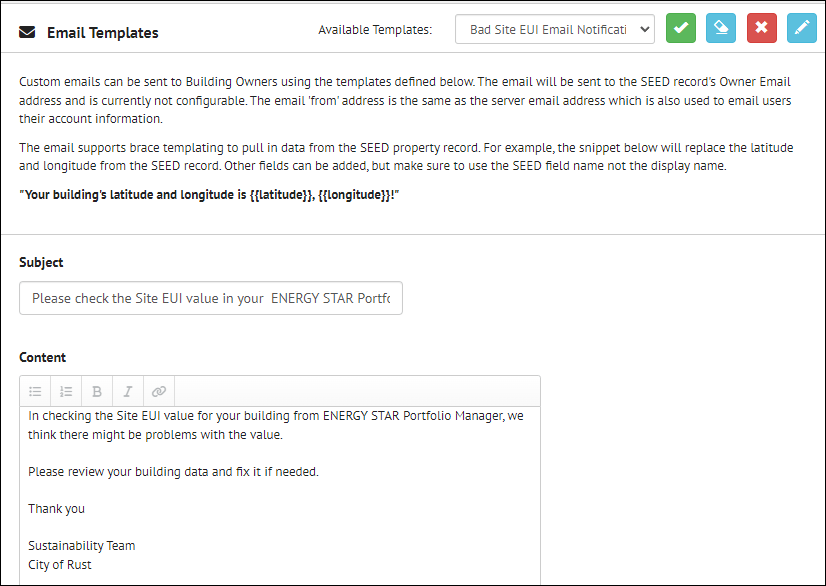
Email Templates: manage email templates, which can be used to send "bulk" emails to contacts for SEED records, including creating new templates, editing and deleting existing templates
-
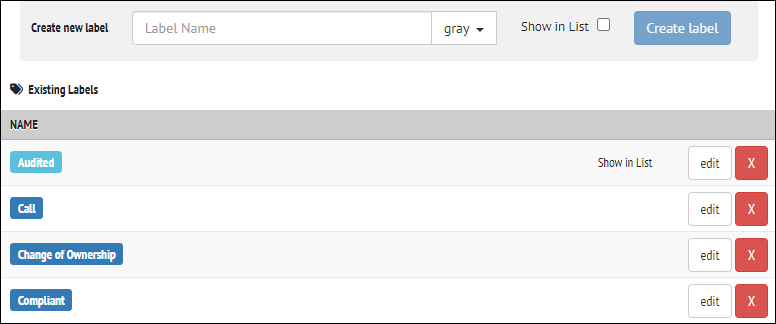
Labels: manage labels, which can be added to Inventory records (property and tax lots), including creating new labels, editing and deleting existing labels
-
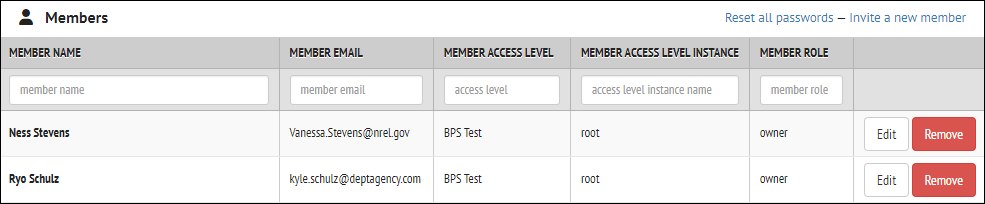
Members: manage access to SEED by adding, editing or deleting members, including setting permissions such as Access Levels and Roles (Owner, Member or Viewer)
-
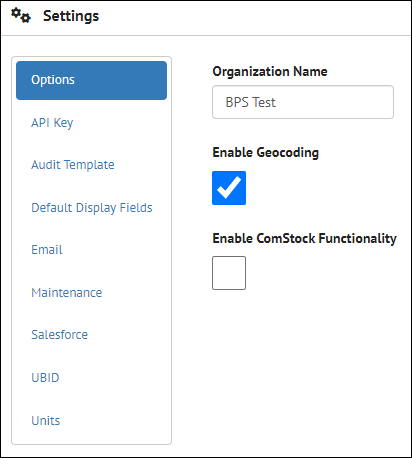
Settings: manage many different settings, including API keys (for geospatial definitions, Audit Template import, and BETTER analyses), default display fields, Salesforce connections, UBID matching, and units for numeric fields.
-
Sharing: manage what fields are shared
-
Sub-Organization: manage sub-organizations, if any, to the main organization
Insights
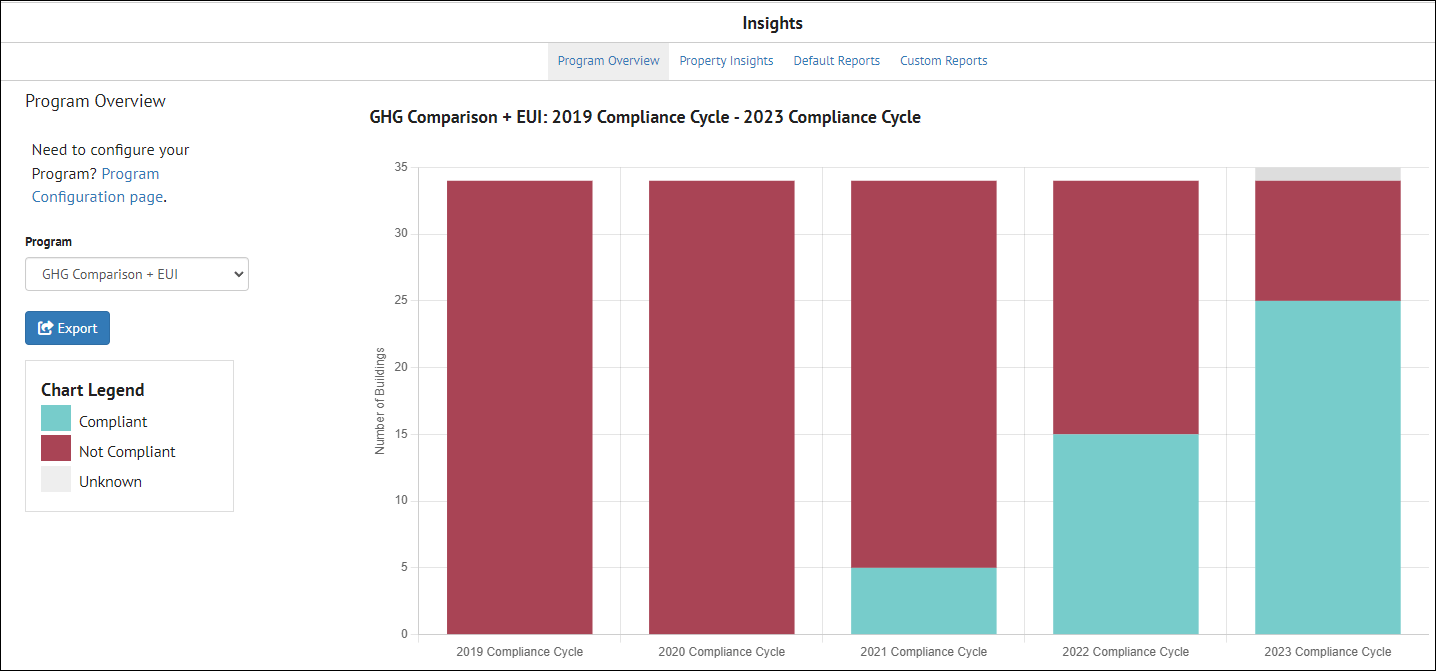
The Insights feature in SEED allows analysis of building energy benchmarking or Building Performance Standards compliance over time based on setting performance targets into the future and showing how buildings are meeting those targets, both individually and as a group, over specific time periods.
Insights
Program Overview shows the compliance of a portfolio of buildings over time. In the example below, compliance is shown over a 5 year time period, 2019 - 2023, with the compliance of the buildings increasing during that period. The red column areas show non-compliance and the blue column areas show compliance.
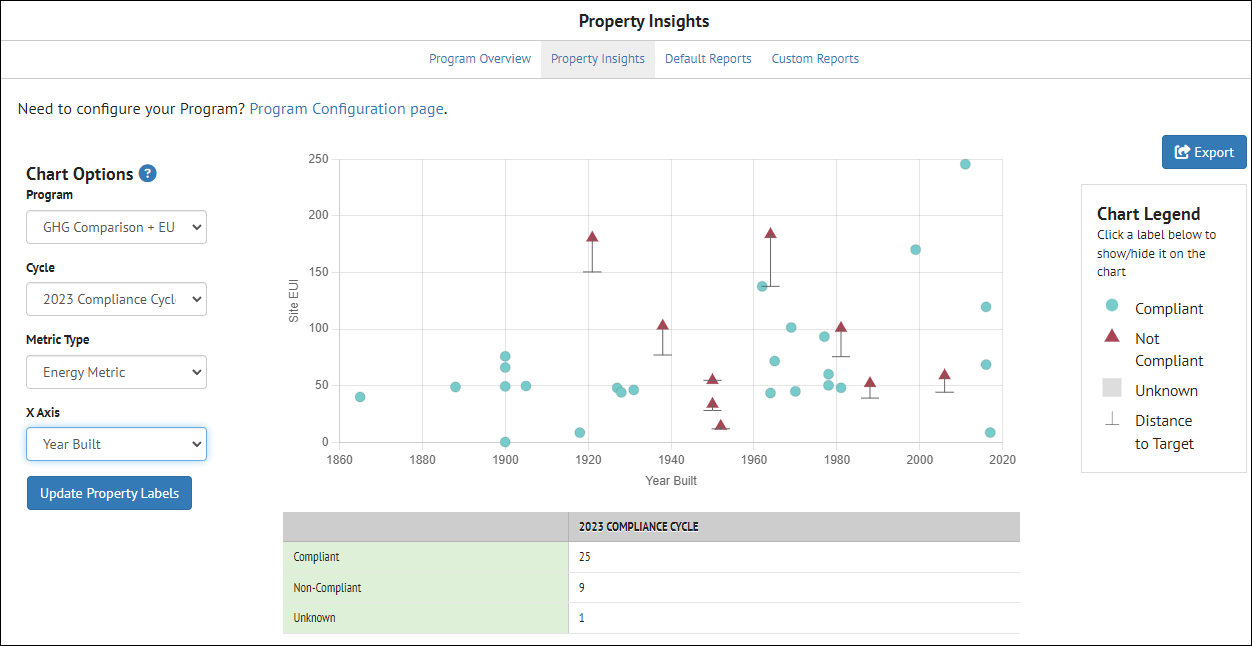
Property Insights shows compliance of individual buildings for a particular period of time (cycle), where the blue dots indicate buildings that have met their compliance targets, and the red triangles indicate buildings that have not met their targets, with the "whisker line" showing the distance from compliance for those buildings.
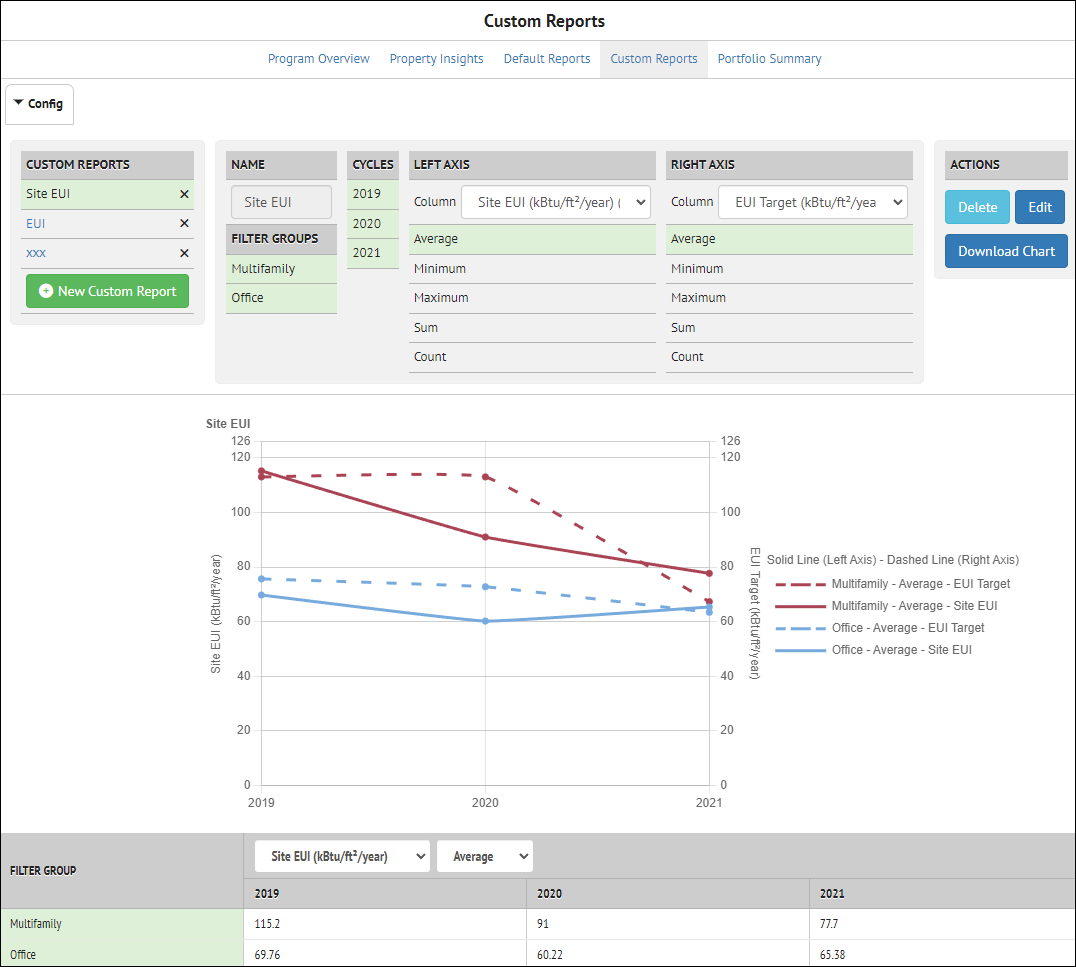
Custom Reports shows compliance trends, compared to a target, over time in a graph
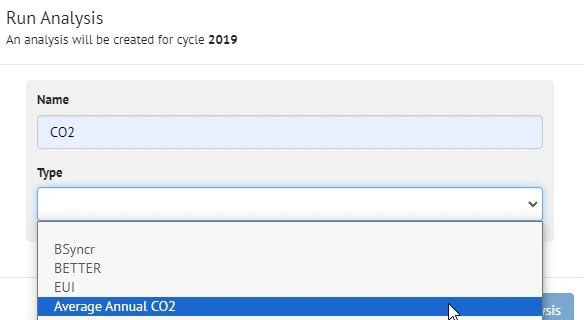
Analyses
The Analyses feature has many different analysis options, including the following:
- BSyncr
- BETTER
- EUI
- Average Annual CO2
Analyses
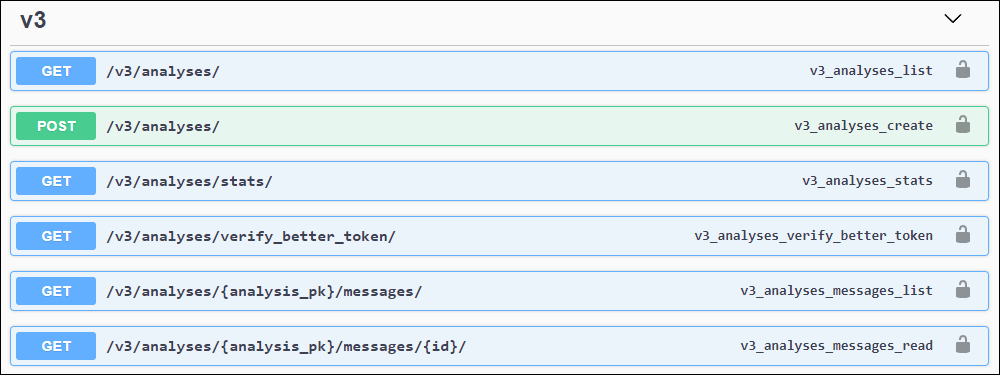
API Documentation
The API Documentation page uses Swagger to document, in detail, the API calls that are available to access data in SEED.
API Documentation
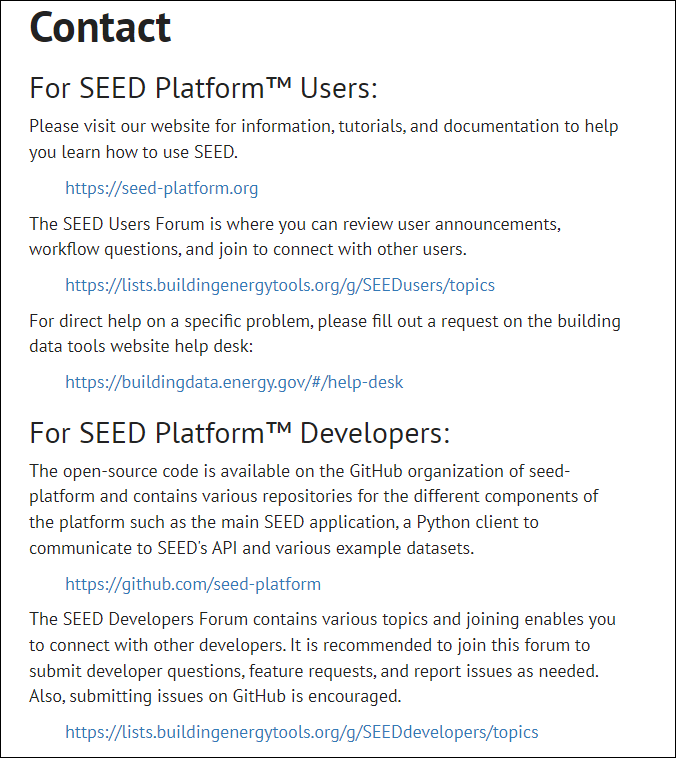
Contact
The Contact page has information and links to various websites about SEED, as well as a link to the SEED Github open source repository.
Contact
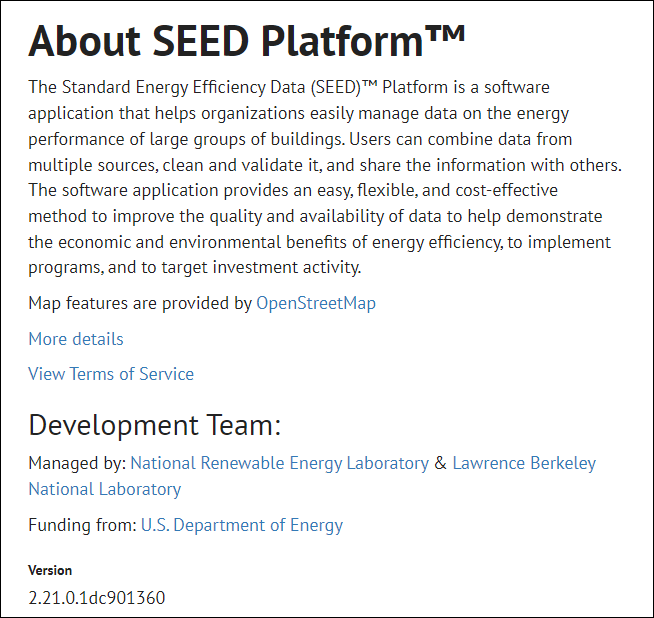
About
The about page has information about the development team as well as the version number of the program release being used.
About
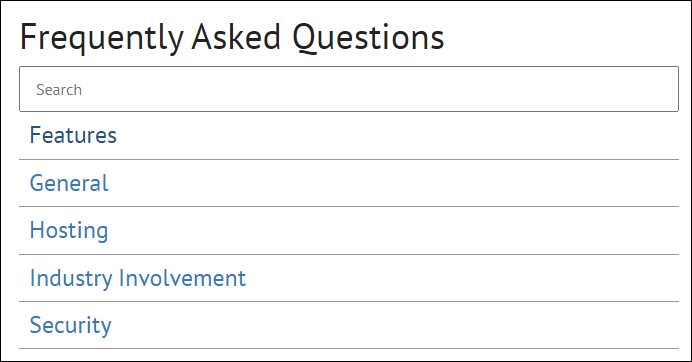
Documentation
The Documentation page has a series of Frequently Asked Questions.
Documentation
Logout
Clicking the Logout navigation button will log the user out of the current session, and allow the user to log in again.
Logout